NVTOP: Neat Videocard TOP
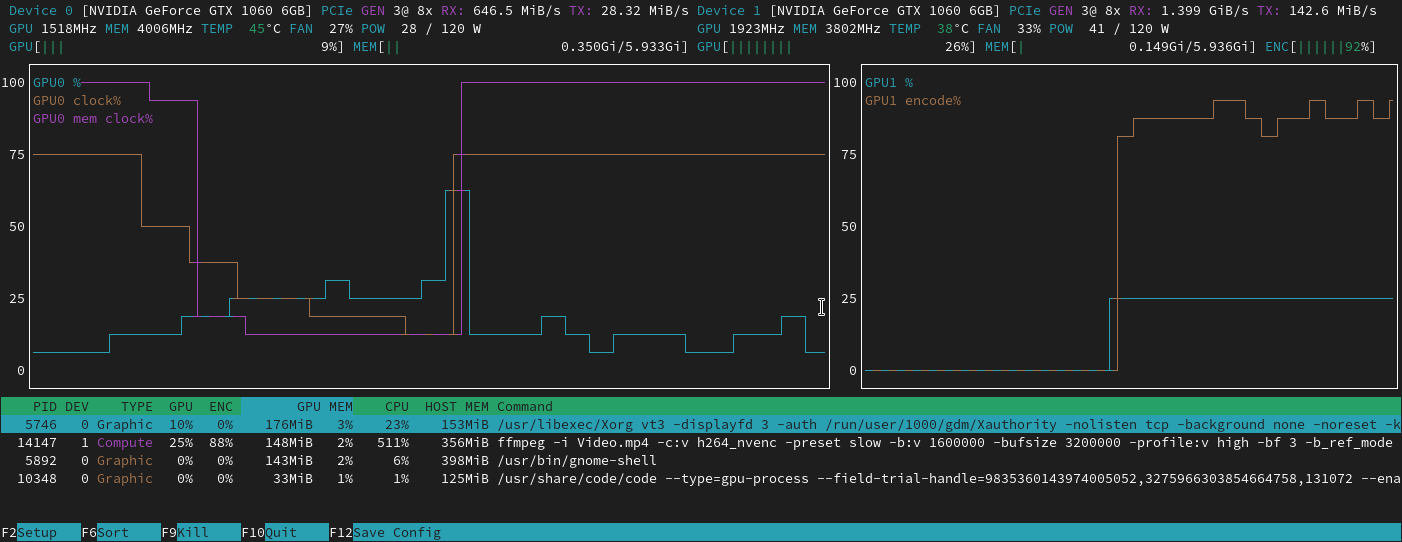
NVTOP is a command-line task monitor for GPUs and accelerators, similar in style to htop. It provides a real-time, interactive view of GPU usage, memory, power, and the processes utilizing the hardware. It is designed to be a comprehensive tool for developers, system administrators, and researchers working with GPU-intensive applications.
Key Features
- Multi-Vendor Support: Monitors a wide range of hardware from vendors including NVIDIA, AMD, Intel, Apple, Huawei, Qualcomm, and more.
- Interactive UI: A familiar,
htop-like interface that allows for easy navigation, sorting, and process management. - Detailed Metrics: Provides detailed information on GPU utilization, memory usage, clock speeds, power draw, temperature, and PCIe throughput.
- Per-Process Monitoring: Lists all processes utilizing the GPU, showing their individual resource consumption.
- Customizable Interface: An interactive setup window allows you to customize the displayed metrics, chart behavior, and process list columns.
- Multiple Installation Methods: Available through most major distribution package managers, as a standalone AppImage, Snap, Conda package, or can be built from source.
Getting Started
Ready to get started? Follow our guides to get nvtop up and running.
- Installation Guide: Detailed instructions for installing
nvtopon your system. - Quick Start: A minimal guide to running
nvtopfor the first time. - Supported Hardware: Check if your hardware is supported and what drivers or kernel versions are required.